Why Spatial Analysis Is Your Secret Weapon in GIS
Spatial analysis techniques transform raw geographic data into powerful insights that drive smarter decisions across countless industries. These methods allow professionals to uncover hidden patterns, predict trends, and solve complex location-based problems that would otherwise remain invisible. At its core, spatial analysis provides the framework to understand not just where things are, but why they’re there and how they relate to their surroundings. City planners harness these techniques to optimize emergency response networks by analyzing travel times to hospitals, while environmental scientists use them to track deforestation patterns and predict future hotspots. Retail chains rely on spatial analysis techniques to identify ideal store locations by overlaying demographic data with competitor positions and traffic flows.
If you’re looking to expand your toolkit, check out our comprehensive guide to GIS tools that underpin those techniques.
The true power lies in how these techniques reveal relationships between geographic features that simple mapping cannot show. Emergency managers during disasters combine elevation data with flood models to predict which neighborhoods will be inundated first, enabling targeted evacuations. Public health officials apply spatial statistics to track disease spread, identifying clusters that reveal transmission patterns.
What makes spatial analysis indispensable is its ability to answer critical “what if” scenarios through geospatial modeling – testing how new infrastructure will impact traffic, how zoning changes might affect property values, or how climate shifts could alter agricultural productivity. These spatial analysis techniques turn static maps into dynamic decision-making tools that consider multiple layers of constantly changing data. From optimizing delivery routes to protecting endangered species habitats, spatial analysis provides the evidence-based approach needed in our increasingly data-driven world.
The organizations and professionals who master these spatial analysis techniques gain a competitive edge, able to make location-intelligent choices that save time, reduce costs, and often save lives. In fields as diverse as urban planning, logistics, epidemiology, and conservation, spatial analysis has become not just useful but essential for solving the complex spatial challenges of our time.
1. Buffer Zones: The “Safety Radius” Tool
Buffering is also part of spatial analysis techniques create precise geographic boundaries by drawing a consistent radius around map features, whether they’re individual locations, connected paths, or shaped areas. This fundamental GIS tool establishes defined spatial relationships by generating new polygons that represent everything within a specified distance of the original features. City planners might buffer school zones to identify residential areas within walking distance, while environmental scientists could buffer rivers to map protected wetlands corridors.
The spatial analysis technique accounts for real-world measurement needs by maintaining exact distances in all directions from the feature’s edges, creating clear zones of influence that can be analyzed, mapped, or used in further spatial operations. Buffers transform single features into areas of potential impact, service coverage, or vulnerability.
How to try it:
- Open QGIS (free)
- Use the Buffer tool under Vector > Geoprocessing
- Set distance (e.g., 500 meters around schools)
Checkout more Blog posts from GeoInfoSpot
2. Overlay Analysis: GIS’s Superglue
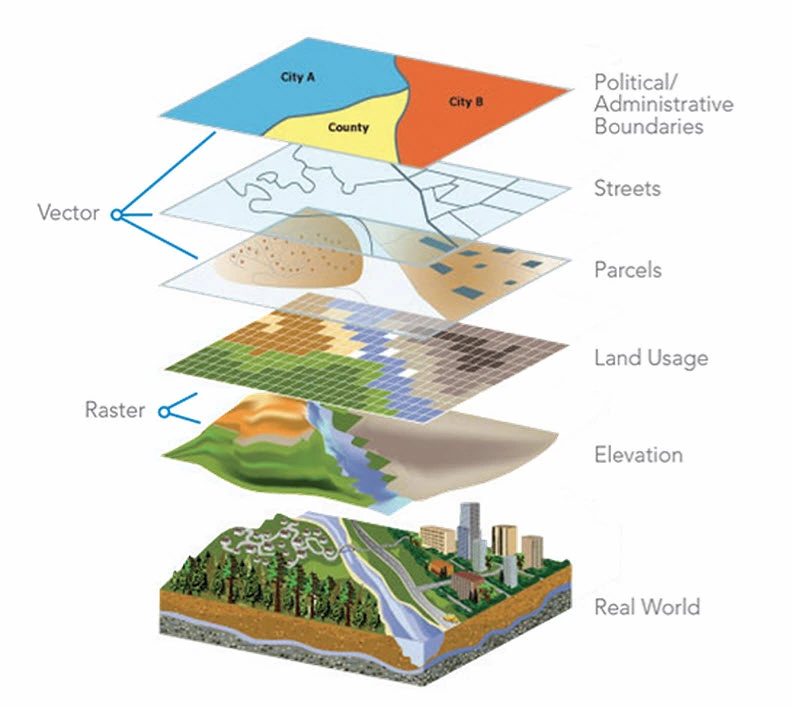
Overlay analysis is the powerful GIS technique that combines multiple map layers to reveal hidden relationships between different types of spatial data. Imagine stacking transparent maps of soil quality, elevation, and land ownership on top of each other – overlay analysis lets you see exactly where these layers intersect and interact. This method creates new insights by identifying areas where different conditions overlap, like finding parcels of land that have both fertile soil and proper drainage for agriculture.
Environmental planners might overlay flood zones with residential areas to assess risk, while marketers could combine income data with competitor locations to find ideal spots for new stores. The true power lies in how overlay analysis can answer complex “where” questions by merging different spatial datasets into a single, actionable map that tells a complete story.
Example: A farmer combines:
- Soil quality maps
- Slope steepness
- Water access
Types of overlays:
- Intersect: Keeps only overlapping areas
- Union: Combines everything
- Difference: Removes overlapping zones
Free data to practice:
Download land use and elevation layers from Natural Earth.
3. Heatmaps: Where Problems Cluster
Heatmaps transform raw point data into visual clusters of intensity, revealing patterns that would otherwise remain hidden in spreadsheets of coordinates. These colorful density maps work by calculating concentrations of events or features, showing hotspots in warm colors like red and orange while marking sparse areas with cool blues and greens. Urban planners use heatmaps to identify accident-prone intersections that need redesign, while epidemiologists track disease outbreaks by visualizing case concentrations across neighborhoods.
The technique automatically detects meaningful groupings regardless of arbitrary boundaries, making it perfect for spotting trends in crime reports, customer locations, or environmental hazards. By converting individual data points into smooth gradients of probability and density, heatmaps help decision-makers quickly focus on areas needing urgent attention.
Case Study:
The NYPD used heatmaps to reveal burglary patterns—then redistributed patrols, cutting thefts by 18% in high-risk areas.
How to create one:
- Load point data (e.g., traffic accidents)
- In ArcGIS Online, click Analysis > Calculate Density
- Adjust radius until patterns emerge
Common mistakes:
- Using too small a radius (creates “blobs” instead of trends)
- Forgetting to normalize by population (a city with more people will always have more crimes)
4. Network Analysis: The Shortest Path Finder
Network analysis solves critical routing challenges by calculating optimal paths through interconnected systems like roads, utilities, or transit lines. This technique models real-world connections as nodes and edges, then applies algorithms to determine the most efficient routes based on criteria like distance, travel time, or cost. Emergency responders use it to find the fastest way to accident scenes, logistics companies optimize delivery routes, and city planners evaluate public transportation coverage.
The power lies in its ability to account for real constraints – one-way streets, road closures, or varying speed limits – transforming abstract networks into practical navigation solutions. Whether finding the shortest path between two points or analyzing overall network resilience, this approach turns complex webs of connections into actionable intelligence for better decision-making.
Tools to try:
- QGIS with the Road Graph plugin
- Google Directions API (for real-time traffic)
5. Spatial Interpolation: Guessing the Gaps
Spatial interpolation bridges the gaps between known data points by estimating values across continuous surfaces where measurements don’t exist. This powerful technique takes scattered field measurements like rainfall amounts or pollution levels and creates a smooth, predictive surface that reveals hidden patterns across entire landscapes. Environmental scientists use it to map contaminant plumes from limited well samples, while geologists reconstruct underground mineral deposits from borehole data. The method works by assuming nearby locations are more similar than distant ones, mathematically weighing neighboring values to make intelligent predictions for unmeasured areas. From creating elevation models to predicting disease spread, spatial interpolation turns sparse data points into complete, actionable maps that drive critical decisions.
Methods compared:
| Technique | Best For | Example |
|---|---|---|
| IDW | Quick estimates | Soil pH maps |
| Kriging | Precision + error margins | Gold mining surveys |
FAQ: Quick Answers to Common Questions
Q: What is spatial analysis in GIS?
A: Spatial analysis is the process of examining geographic data to identify patterns, relationships, and trends. It helps answer location-based questions like “Where are the best areas to build a new store?” or “Which neighborhoods are most at risk during a flood?”
Q: Why should I learn these 5 Spatial Analysis techniques first?
A: These spatial analysis techniques—buffer zones, overlay analysis, heatmaps, network analysis, and spatial interpolation—are the most widely used in real-world applications. Mastering them gives you a strong foundation for jobs in urban planning, environmental science, logistics, and emergency management.
Q: Do I need expensive software to practice spatial analysis?
A: No! Free tools like QGIS, Google Earth Engine, and ArcGIS Online offer these functions. Many datasets (e.g., from NASA or USGS) are also freely available.
Q: Which technique is best for finding service areas (e.g., delivery zones)?
A: Buffer zones are perfect for this. For example, you can draw a 5-mile radius around a warehouse to see which customers fall within delivery range.
Q: How do heatmaps help in decision-making?
A: Heatmaps visualize density (e.g., crime hotspots, customer locations). They highlight clusters so you can allocate resources efficiently—like placing police patrols where crime rates are highest.
Q: What’s the difference between network analysis and overlay analysis?
A:
- Network analysis focuses on routes and connectivity (e.g., shortest path for ambulances).
- Overlay analysis combines multiple map layers (e.g., soil + elevation + land use) to find optimal locations.
Q: When should I use spatial interpolation?
A: When you have limited sample points (e.g., weather stations) but need to estimate values across a whole area (e.g., rainfall maps). It’s key for environmental monitoring and agriculture.
Q: Can I automate these techniques?
A: Yes! Python libraries like Geopandas and ArcPy let you run spatial analyses with code—saving hours of manual work.
Free tutorial:
Follow Esri’s interpolation guide using their sample rainfall data. Read next: Satellite Imagery Explained: Optical vs Radar vs Thermal.